A/B testing is a method to compare two versions of a system to determine which performs better, using real user behavior as evidence. In recommendation systems, it helps companies like Amazon and Netflix refine algorithms, improve user interfaces, and boost engagement. Here’s what you need to know:
- Key Metrics: Click-through rate (CTR), conversion rate, average order value (AOV), user retention, and revenue growth.
- Amazon’s Approach: Transitioned from user-based to item-to-item collaborative filtering for faster, better recommendations. Testing layouts and visuals further increased CTR and revenue.
- Netflix’s Strategy: Personalizes artwork for users through dynamic testing, tracking engagement metrics like play duration and take rates. They fine-tune visual assets, including motion billboards and trailers.
- Lessons Learned: Testing ensures data-backed decisions. Companies like Booking.com run thousands of tests simultaneously, focusing on user segmentation, clear goals, and statistically valid results.
A/B testing drives measurable improvements in user engagement and revenue, making it a critical tool for modern recommendation systems.
Mastering Recommendation Systems Evaluation: An A/B Testing Approach with Insights from the Industry
sbb-itb-edfb666
Case Study: Amazon‘s A/B Testing for Product Recommendations
Amazon’s approach highlights how ongoing A/B testing fuels improvements in both algorithms and user interfaces for recommendation systems.
Collaborative Filtering vs. Hybrid Models
Amazon’s evolution in recommendation algorithms shows the power of A/B testing to refine and optimize. Initially, the company used user-based collaborative filtering, but it quickly proved inefficient. Comparing each user to millions of others was too slow for real-time recommendations. To solve this, Amazon adopted item-to-item collaborative filtering, which focuses on product correlations – like recommending item B to customers who buy item A. This shift allowed faster daily updates and delivered better recommendations.
By 2014, Amazon’s Prime Video team tested deep neural networks against the item-to-item approach. Surprisingly, the neural model initially performed worse than a basic bestseller list. The breakthrough came when the team, led by Vijai Mohan, restructured the model to analyze chronologically sorted data. This allowed it to predict viewing behavior for the next one to two weeks. By blending behavioral patterns with time-based factors, this hybrid model outperformed traditional collaborative filtering by a two-to-one margin.
"The world was focused on user-based collaborative filtering… We sort of turned it on its head and found a different way of doing it that had a lot better scaling and quality characteristics for online recommendations." – Brent Smith, Leader of Amazon’s Weblab
This algorithmic improvement paved the way for further experimentation with how recommendations are displayed.
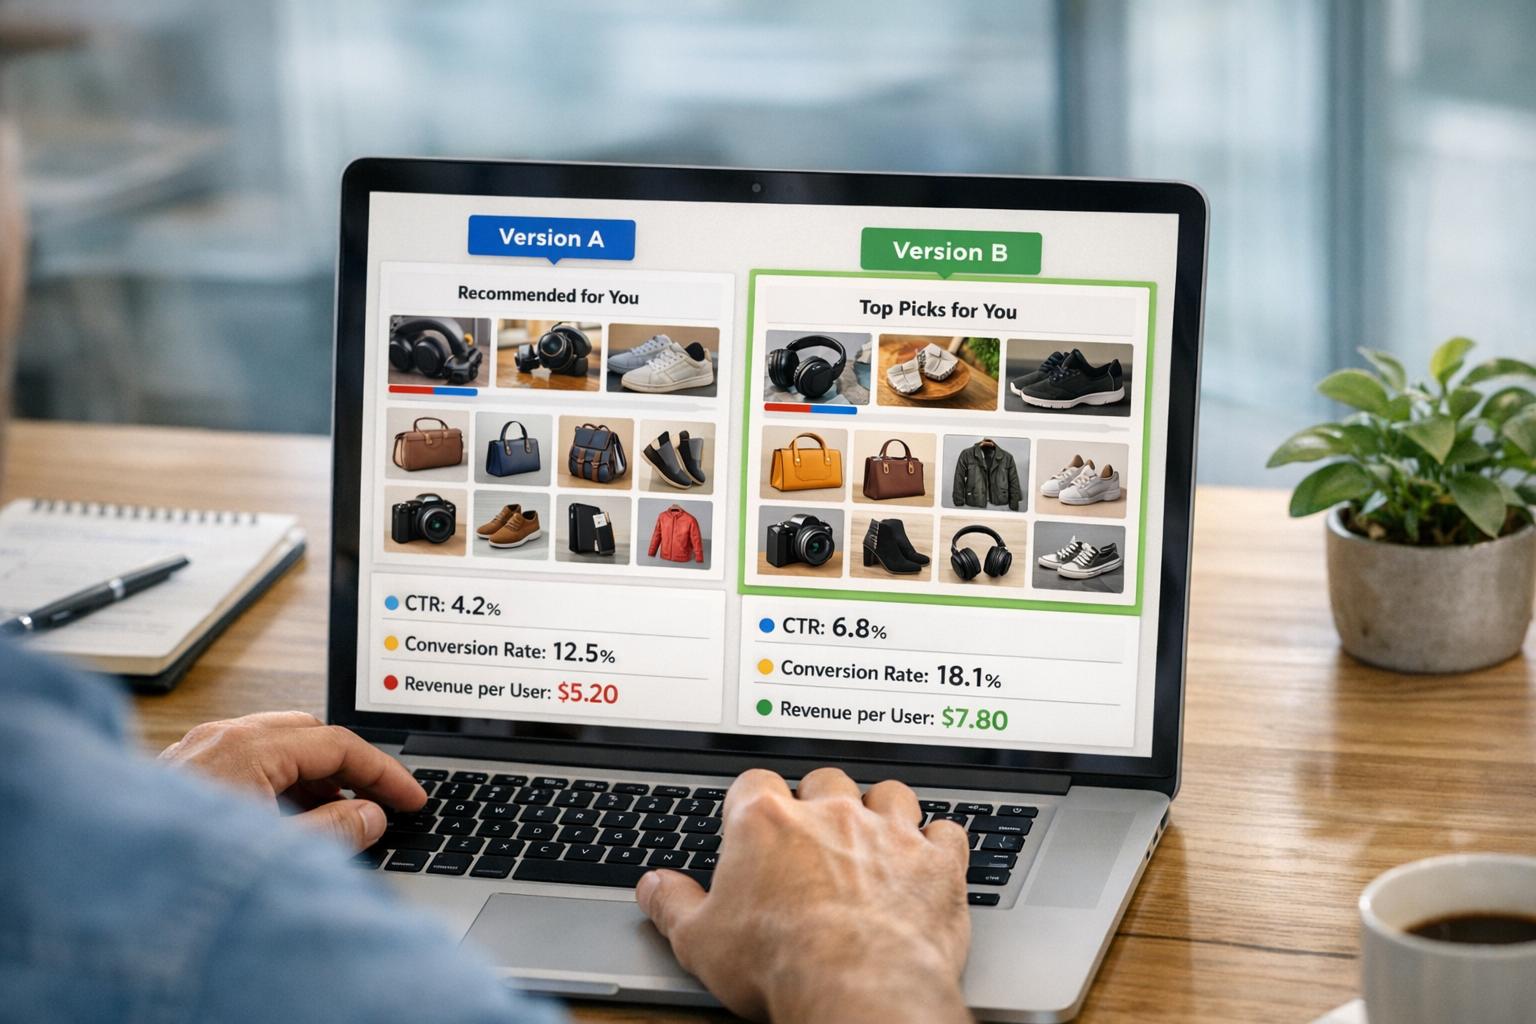
Testing User Interface Variations
With better algorithms in place, Amazon shifted focus to testing how recommendations are presented. They experimented with different layouts, such as carousels versus grid views, varied the number of items displayed, and adjusted the placement of recommendation blocks. These tests measured the impression-to-click ratio (or "take rate") – essentially, how often users engage with recommendations they see. Even small tweaks, like changes to artwork or layout, can significantly influence click-through rates.
Results and Business Impact
The results speak volumes. Amazon’s recommendation system drives 35% of its total revenue. Through platforms like Amazon SageMaker and Amazon Personalize, the company continuously refines its recommendations with dynamic A/B testing. For example, AWS customer Pulselive saw a 20% boost in video consumption by adopting hybrid models. These outcomes reinforce the importance of A/B testing as a cornerstone of Amazon’s strategy.
Case Study: Netflix‘s Personalization Through A/B Testing
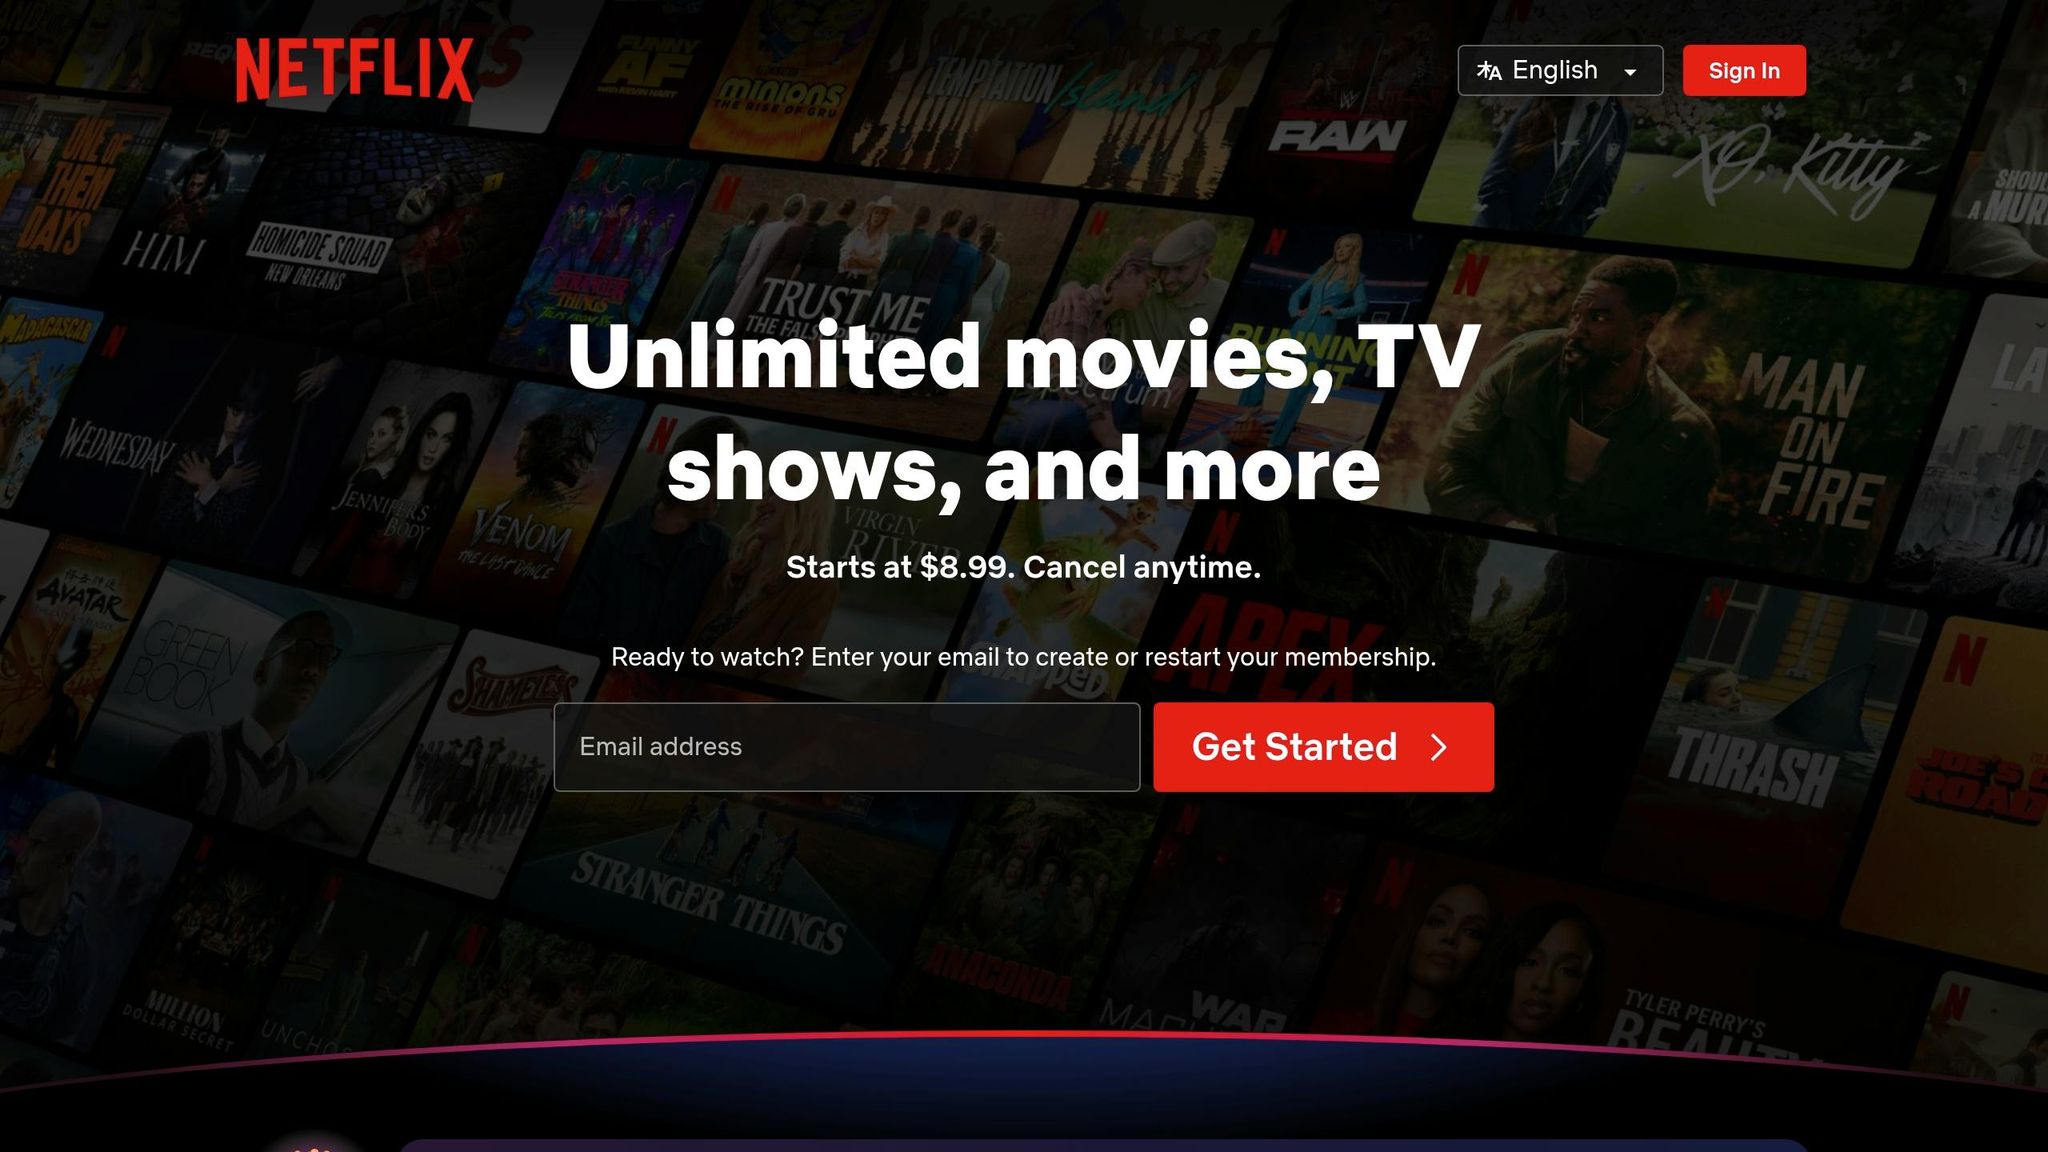
Netflix, much like Amazon, has demonstrated how testing creative assets can significantly boost user engagement. Their strategy revolves around a critical insight: they have just 90 seconds to capture a user’s attention before they lose interest. This understanding drives their A/B testing approach, which focuses heavily on visual elements to create a seamless, engaging user experience.
Segment-Based Testing for Personalization
Netflix has taken A/B testing to the next level with a dynamic assignment system that personalizes artwork for individual users. Unlike traditional fixed-cell A/B tests, this method dynamically assigns artwork variants for each (member, title) pair at the moment of display. Known as title-level explore testing, this approach enables Netflix to quickly gather data, even for niche content. The process includes two phases:
- Explore Phase: Tests multiple artwork variants to measure engagement.
- Exploit Phase: Displays the most successful variant to maximize total streaming hours.
What’s fascinating is how regional preferences factor into these tests. The winning artwork can vary widely depending on the viewer’s location, making this dynamic system even more impactful. By tailoring visuals to individual preferences and regional trends, Netflix ensures that engagement metrics are as precise as possible.
Metrics Driving Optimization
To fine-tune their personalization efforts, Netflix tracks an array of metrics with meticulous attention to detail. They monitor:
- Take rates: How often users engage with a title after seeing its artwork.
- Aggregate play duration: The total time users spend watching.
- Content viewed: Titles that gain traction based on the artwork.
At the same time, they keep an eye on short plays, which indicate that the artwork might not accurately represent the content. Every day, billions of micro-events are logged across devices like TVs, smartphones, and tablets to determine which visuals resonate best with users.
Lessons from Netflix’s Iterative Testing
Netflix’s approach to testing is rooted in constant improvement and fast-paced iteration. Gopal Krishnan from Netflix’s Technology Blog explains it best:
"Netflix’s A/B testing philosophy is about building incrementally, using data to drive decisions, and failing fast".
This philosophy has been evident since their early experiments. For instance, tests on the documentary The Short Game revealed that different artwork could attract a broader audience. These insights paved the way for larger explore-exploit tests and the advanced dynamic assignment system they use today.
Netflix hasn’t stopped at static artwork either. They’ve expanded their testing to include motion billboards, trailers, and montages, optimizing multiple asset types at once. By tracking impressions and using lineage IDs to connect related visuals across formats and languages, Netflix ensures their personalization efforts are always evolving. This iterative process highlights their commitment to refining recommendations and enhancing the overall user experience.
Cross-Industry Lessons from A/B Testing in Recommendation Systems
A/B Testing Results Comparison Across Major Platforms
Key Takeaways from Case Studies
Looking at the strategies of industry giants like Amazon, Netflix, and Booking.com, one thing becomes clear: testing is non-negotiable. For instance, Booking.com has adopted a rigorous policy where every change is vetted through controlled experiments. This disciplined approach has played a significant role in their ability to maintain double-digit revenue growth, culminating in an estimated $21.3 billion in annual revenue in 2023.
Platforms often evolve their testing methods over time, starting with simple A/B tests and gradually moving toward more advanced frameworks like explore-exploit models. This progression allows companies to take calculated risks while extracting maximum insights. Interestingly, only 20–30% of A/B tests deliver measurable wins. This statistic underscores the value of learning from failures, which are just as informative as successes.
Another universal takeaway is the importance of user segmentation. A one-size-fits-all approach rarely works, as preferences vary widely. For example, what appeals to first-time users might alienate returning customers, and mobile-friendly designs might not translate well to desktop. Both Netflix and e-commerce platforms have seen how regional differences can drastically affect outcomes. The same recommendation that clicks with users in Chicago might flop in Buenos Aires.
Best Practices for A/B Testing in Recommendation Systems
Start by defining clear goals. Before running any test, identify primary metrics and guardrail metrics to track. Netflix, for example, learned to monitor short-duration plays alongside engagement data. This helped them spot cases where eye-catching artwork attracted clicks but failed to align with the actual content.
Next, ensure proper execution. Use control groups and allow tests to run long enough to gather meaningful data. High-contrast variants can improve statistical significance by 2.3 times, but jumping to conclusions too early can lead to errors. A good rule of thumb is to aim for at least 300 conversions per segment before declaring a winner. For dynamic tests, warm-up periods are essential to collect enough impressions before shifting traffic to the winning variant.
When you do identify a winning variant, roll it out carefully. Start small – perhaps 10% of your traffic – and monitor for any unexpected issues, like performance slowdowns or negative user feedback. Gradually scale up to 100% once you’re confident in the results. Automated rollouts via API gateways can make this process smoother and safer. Booking.com illustrates this well with their philosophy:
"A product manager who runs 10 experiments and learns that 8 of them don’t improve conversion has contributed more to the business than one who ships 3 changes based on intuition"
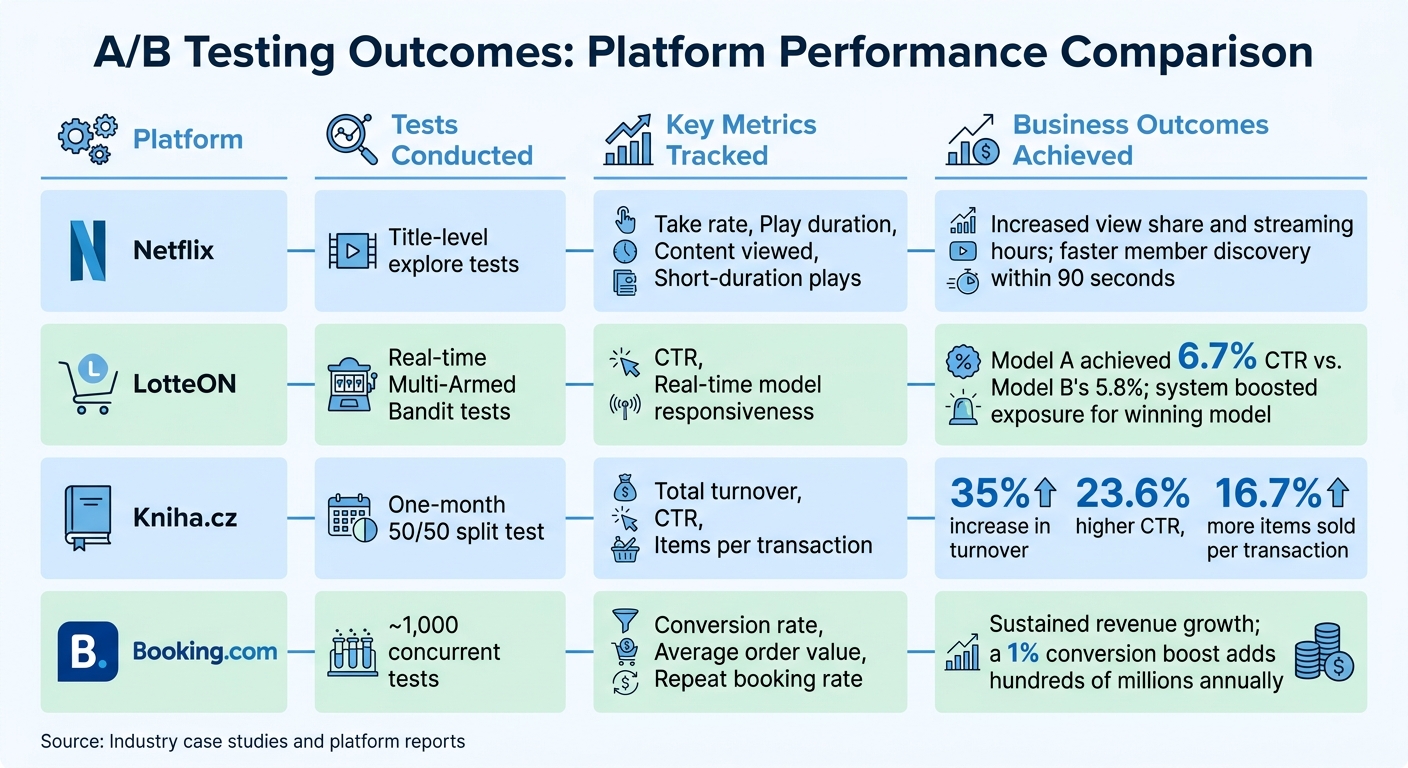
Comparison of A/B Testing Outcomes
Here’s how some top platforms have leveraged A/B testing to achieve business success:
| Platform | Tests Conducted | Key Metrics Tracked | Business Outcomes Achieved |
|---|---|---|---|
| Netflix | Title-level explore tests | Take rate, Play duration, Content viewed, Short-duration plays | Increased view share and streaming hours; faster member discovery within 90 seconds |
| LotteON | Real-time Multi-Armed Bandit tests | CTR, Real-time model responsiveness | Model A achieved 6.7% CTR vs. Model B’s 5.8%; system boosted exposure for winning model |
| Kniha.cz | One-month 50/50 split test | Total turnover, CTR, Items per transaction | 35% increase in turnover, 23.6% higher CTR, 16.7% more items sold per transaction |
| Booking.com | ~1,000 concurrent tests | Conversion rate, Average order value, Repeat booking rate | Sustained revenue growth; a 1% conversion boost adds hundreds of millions annually |
Conclusion
The case studies discussed here all point to one clear takeaway: A/B testing is a game-changer for smarter optimization. Consider Kniha.cz, which boosted its total turnover by 35% in just one month by experimenting with personalized recommendations. Or take the example of a major U.S. wine distributor, which uncovered a staggering $4.2 million in potential annual revenue through 23 well-planned tests. These examples highlight how data-driven decisions can deliver measurable, impactful results.
Top-performing companies prioritize evidence over gut feelings. Booking.com’s approach captures this ethos perfectly:
"Nothing ships without a test"
Their commitment to testing is reflected in their practice of running up to 1,000 experiments simultaneously during peak times. Even small improvements – like a 1% boost in conversion rates – can translate into significant revenue growth.
The evolution from static to dynamic testing marks an important shift. Traditional 50/50 splits often result in underperforming models being tested for the entire duration. In contrast, dynamic approaches, such as Multi-Armed Bandit algorithms using Thompson sampling, adapt in real time to prioritize better-performing models. A great example is LotteON, which used hourly parameter updates to improve click-through rates while maintaining a seamless user experience. Starting small with clearly defined, statistically valid metrics and scaling successful variants is a practical way to adopt this strategy.
FAQs
How long should an A/B test run?
When conducting an A/B test, it’s crucial to let it run long enough to collect enough data to achieve statistical significance. In simple terms, this means you should keep the test going until you can confidently determine which version performs better based on your chosen key performance indicator (KPI).
The exact time frame for this can vary depending on factors like traffic volume or the nature of the test. Some companies, such as Booking.com, don’t stick to rigid timelines. Instead, they run many tests at once, continuously refining their results over time to make the most of their optimization efforts.
What guardrail metrics prevent “fake wins”?
Guardrail metrics play a crucial role in ensuring the integrity of A/B testing by keeping the focus on actual user behavior. These metrics, such as conversions, click-through rates, and engagement levels, help confirm that any observed improvements are legitimate. They act as safeguards, filtering out results that might otherwise be influenced by random chance or statistical quirks, ensuring that the changes you see reflect true, meaningful progress.
When should I use bandits instead of 50/50?
When you need to dynamically shift traffic toward the best-performing options in real time, bandits are the way to go. Unlike a static 50/50 split, which evenly divides traffic regardless of performance, bandits continuously adapt based on user behavior. This approach helps optimize for higher conversions or engagement as it learns and adjusts over time.